Jinzhao Wang
Head of Client Solutions
With many mortgages out of the money to refinance, understanding discount prepayments has become critical for MBS investors. One of the biggest speedups in prepayments has come from selecting the right states. Due to the deep discount prices of MBS, even small differences in prepayment across regions can boost returns.
Currently traded geographical (“geo”) stipulations in the Specified Pool market include Florida, Texas, New York, and Puerto Rico. As the pandemic set off migration trends and home price changes across US states, more state stories emerge with prepayment characteristics that could be worth more than they are trading.
Methodology
To explore new state stories, we leverage Infima’s tools to look at both historical prepayment across the 50 states in 2022 as well as projected speeds for the rest of 2023. That way, investors can both understand historical trends and turn predictive insights into potential trade ideas.
We start by selecting the 50 largest outstanding pools in each state with a 5.5% coupon or lower. These pools are backed by out-of-the-money loans and have 95% or higher concentration in a particular US state. With these criteria, we can focus on the turnover speeds for each state. Having curated this data, we apply a binning approach to control for collateral characteristics while analyzing how much faster or slower each state prepays (Appendix). Specifically, we bin the 2,500 pools based on a set of attributes, including gross coupon, loan age, loan size, credit score, and servicers, among others. Then, we compute the percentage difference in speeds between each state and the average state, defined as the weighted average speed across all pools of any bin. Finally, we aggregate across bins to compute the overall speed difference for each state.
Historical differences in 2022
Looking at realized prepayment speeds last year, Arizona, Colorado, and Utah showed more than 20% higher prepayment than those from the average state (Exhibit 1). These Southwestern states have seen more in-migration since the pandemic, which could contribute to their stronger housing markets and population growth. Their outperformance in speeds seems to have even surpassed that of Florida and Texas, which are established turnover stories that the market prices at a pay-up to TBA.
Exhibit 1: AZ, CO, and UT prepaid the fastest while Northeastern states lagged in 2022

Source: Infima Technologies. Notes: This analysis uses a binning approach to account for collateral characteristics of the pools while comparing state-level speeds. Specifically, it assigns pools to bins in each of which the pools are close in range across these characteristics. Then for each bin, it computes the percentage difference in speeds between each state and the average state. It does that by aggregating to the state level all the percentage differences in speeds between every pool in that state and the average pool, weighted by the current balance of each pool. Finally, it aggregates across bins, weighted by the total outstanding balance of each state in that bin, and finds the overall percentage difference in speeds for each state. States with the largest absolute percentage differences are displayed in this exhibit.
On the other hand, pools originating in the Northeast, such as New York, Virginia, and New Jersey, have shown more than 10% of lower prepayment than those from the average state (Exhibit 1). These areas have generally seen an outmigration over the last few years. Minnesota saw the most significant outbound migration last year in over three decades. New York, additionally, has a mortgage recording tax that further suppresses turnover speeds (Exhibit 1).
Infima pinpointed that the fastest states were Utah, Arizona, and Colorado (Exhibit 2). It projected Arizona to prepay faster by more than 20%, Colorado to pay faster by more than 15%, and New York to pay slower by more than 10%. Market participants could therefore rely on Infima’s insights on geo trends to anticipate future prepayment.
Exhibit 2: Infima predicted the three fastest states in 2022

Source: Infima Technologies. Notes: Applying the same binning approach on realized speeds, this analysis leverages the monthly predictions from 2022 using Infima’s live model. States with small origination volumes are excluded for two reasons. First, market participants can source pools concentrated in these states more easily. And second, Infima’s model would show even higher accuracy on pools in these states since there is more history on loans originated there.
Projected Trends in 2023
Given that the US labor market is still strong, home prices are expected to remain stable in the near term. This would mean that regional differences in speeds should prevail. And speed differences due to geography can warrant a pay-up that the market may not be pricing in yet.
Market participants can obtain Infima’s predictions by month to understand nuances in regional prepayment trends. Exhibit 3 shows Infima’s average projected speed for each state during the rest of this year, weighted by the outstanding balance of pools in each state. Arizona, Nevada, and Colorado seem to lead the pack, expected to prepay more than 20% faster than the average state. With lower taxes and cost of living, Nevada saw one of the most significant increases in inbound migration since the pandemic. On the other hand, California is forecasted to prepay more than 15% slower than the average state, likely due to a continuing exodus from the Golden State to other parts of the country. So is the case with Illinois.
Exhibit 3: Arizona, Nevada, and Colorado are projected to prepay the fastest in 2023

Source: Infima Technologies. Notes: This analysis uses Infima’s monthly predictions for March through December 2023 over the largest pools concentrated in each state. Then it applies the same binning approach to determine the percentage differences in CPRs across states.
Even across rate scenarios, Southwestern states are projected to remain the fastest – namely Arizona, Nevada, Colorado, and Utah (Exhibit 4). And while variation across scenarios looks minimal, it is worth noting that the percentage differences in speeds can be slightly larger in the selloff scenario. This may be due to the fact that state effects explored in this article are stronger in a turnover environment. The more rates rally, the more financial incentives tend to play a role in prepayment behavior.
Exhibit 4: Faster states show robust percentage differences across rate scenarios

Source: Infima Technologies. Notes: This analysis uses Infima’s monthly predictions for March through December 2023 in three rate scenarios: baseline and +/- 25 bps. It then applies the same binning approach to determine the percentage differences in CPRs across states.
Market Implications
For specified pool investors, looking at the geographical concentration of a specified pool beyond the current stories of FL, TX, and NY could be a new source of relative value. When a specified pool with significant geographical concentration comes under the stipulation of a non-geo story, its fair value may be mispriced. That deviation from the market value may be exploited.
For TBA traders, identifying delivered pools that prepay faster at a discount could help them monetize the speed differences either by carrying them against a TBA hedge or selling them at a premium to TBA. Through the Pool Query tool on Infima’s web UI, we find FR QF5132 as an example (Exhibit 5). It is currently considered worst-to-deliver but could be worth a small pay-up given its predominant concentration in Arizona:
Exhibit 5: Infima’s web UI assists market participants in finding new geo pools
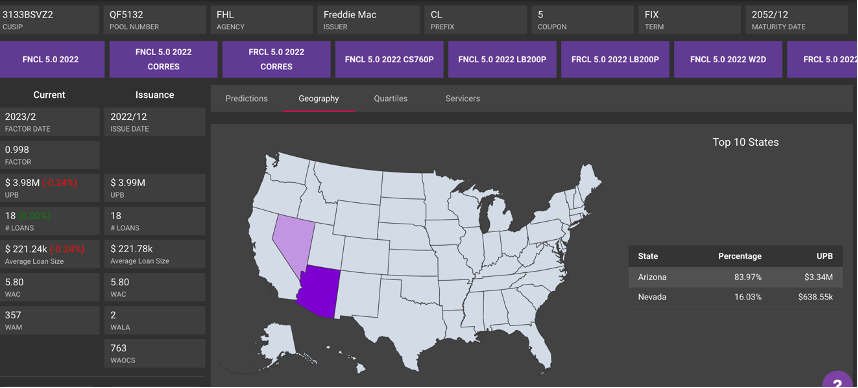
Source: Infima Technologies.
For originators, putting together a pool from states such as Arizona and Nevada - where there may be faster turnover - could allow them to sell it at an additional pay-up. Because the production of agency jumbo loans has slowed in the current high-rate environment, originators now have the capacity to create more specified pools with agency-conforming loans concentrated in specific states.
To help market participants discern upcoming differences in speeds across states, Infima’s loan-level Deep Learning model incorporates granular home price indices, capturing regional trends. Many other nuances in Infima’s modeling approach also help market participants discover the value that could otherwise fall through the cracks.
--
Find additional background information on the methodology, or reach us at infima.io to learn more.