Nicholas Gunther
Co-Founder and Chief Solutions Officer
In the aftermath of the demise of Silicon Valley Bank (SVB), we’d like to share a different take on the story with a perspective driven by advanced prepayment speed analytics. When evaluating assets, particularly long-term assets, extremely accurate prepayment prediction is more crucial than ever for any bank, asset manager or hedge fund with exposure to mortgage-backed securities (MBS) in a portfolio.
What SVB’s meltdown has highlighted is that financial institutions with exposure to agency MBS on their balance sheets need both sufficient in-house MBS expertise and superior insight into future prepayment speeds. Otherwise, those investors may find themselves in deep, dark and uncharted waters.
As shown in Figure 1 below, agency MBS can offer spreads 150 bps or more above Treasury bonds of comparable duration and with little incremental credit risk and a 20% (or lower) risk weighting, making them highly attractive to yield-hungry, regulated investors, including regional banks, and especially those flush with cash from low-interest deposits.
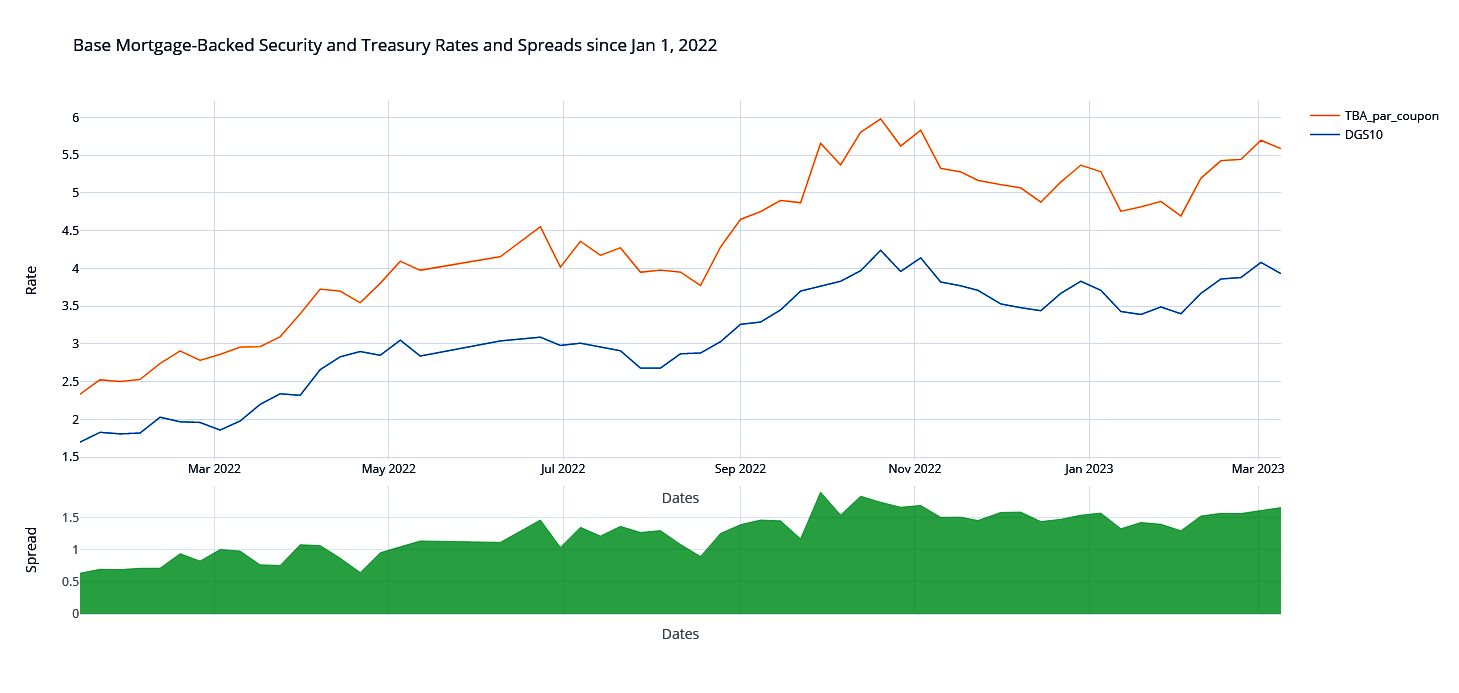
Figure 1: MBS & Treasury Rates and Spreads Sold Off Sharply in 2022
(Treasury data from Edgar, TBAs from Infima)
This is good news for investors with excess cash to invest now, but bad news, sadly, for investors who bought MBS & Treasuries at or before the beginning of 2022. These attractive spreads are not “free lunches,” but rather compensate for prepayment risk – the risk, unrelated to credit, that the MBS prepays or extends at exactly the wrong time from the investors’ perspective, effectively transferring value to the underlying borrowers. (Colloquially, you will (almost) always get paid, but not necessarily when you’d like to be.)
Following the multi-year COVID period of extremely low rates, inflation in 2022 sparked a massive rate surge (again in Figure 1), rivaling any in the last half a century. Unfortunately, the duration of fixed-rate MBS extended as interest rates rose through 2022, giving investors holding longer-term MBS unhedged a “double whammy” with:
Fixed rates now well below market
Locked in for a now much longer term
This is known technically as “negative convexity” and resulted in losses of 20% or more on publicly disclosed MBS portfolios, the durations of which extended over 2023 from four to over six years at the same time that rates soared from under 3 to over 7%, as discussed in the Case Study below.
This is not what fixed-income investors expect, especially regulated ones like banks.
MBS Price Drivers
Market Interest Rates and Current Prices
The best-known driver of MBS prices is the market interest rate, as summarized above, and the 10-year Treasury rate is a standard proxy for the rate on 30-year Agency fixed-rate MBS ('FNCL'). Choosing the price of the ‘MBB’ ETF as a simple, tradeable proxy for MBS prices more generally, Figure 2 shows the strong price-rate relationship, where the 30-year TBA par coupon (the implied rate from ‘To-Be-Announced’ prices) serves as an indicator for FNCL rates. Note the price is shown on the right-hand y-axis, with the price at the beginning of 2022 normalized to 100%. The chart on the right inverts the MBS price graph to facilitate visual appreciation of the close fit, including matching peaks and troughs.

Figure 2: MBS Prices Vary Inversely with Rate Levels
Mortgage prepayments determine the uncertain component of MBS cash flows, and accordingly, MBS prices also track realized prepayments nicely, as shown in Figure 3 below. MBS prices track Infima’s prepayment predictions even more closely, showing the forward-looking aspects of both the predictions and prices.

Figure 3: Infima Prepayment Predictions Track MBS Prices Better
MBS Price Predictors
Unfortunately, although strongly associated with spot MBS prices, interest rates are sub-optimal predictors of future prices for several reasons, among them the following:
Interest rates are notoriously difficult to predict, and
the relationship between rates and prices is in any event not exact.
Moreover, the association between rates and future MBS prices drops quickly with the horizon, as can be seen by shifting the MBB curve to the left in the right-hand panel of Figure 2 and as shown for a one-month shift in the right-hand panel of Figure 4 below. Accordingly, mortgage market participants rely heavily on prepayment predictions, which track both current and future prices, as shown in the left panel in Figure 4. Note the sampling period is longer for Treasury rates in the right panel.

Figure 4: Infima Avg. 6-Month Prepayment Predicitions, not 10-Year Treas. Rates, Predict MBS Prices 1 Month Ahead
The right panel of Figure 4 shows that interest rates often peak a month before MBS prices plunge, with a correlation of negative 71%. The left panel shows that, by contrast, Infima’s prepayment predictions anticipated the decline in MBB prices, with a correlation of 80%.
Case Study: Silicon Valley Bank (SVB)
Many US banks have significant agency MBS positions which declined substantially in value as market rates rose in 2022. We pick as an example Silicon Valley Bank (ticker SIVB), both because of its prominent role in recent headlines and because its securities filings illustrate the progress of its MBS investments.
As shown in Figure 5 below, the notes to the financial statements in SVB’s 2022 10-K show the majority of its total investment securities of $120 billion were comprised of hold-to-maturity (HTM) MBS.

Figure 5: The Majority of SVB’s HTM Assets were in Agency MBS & CMOs that Fell Steeply in Value
Those notes also show how MBS convexity contributed to a dramatic duration extension of 50%:
The weighted-average duration of our HTM securities portfolio was 6.2 years at December 31, 2022, and 4.1 years at December 31, 2021.
There is no indication, however, that SVB hedged this exposure, perhaps because HTM securities need not be marked-to-market through the income statement. Nonetheless, the economic loss of nearly $15 billion was very real, especially compared to SVB’s book equity of only $16 billion.
Finally, Figure 6 demonstrates that in 2022, SVB’s MBS losses followed their build-up of a large portfolio in 2021, as Infima’s predicted prepayments plummeted.
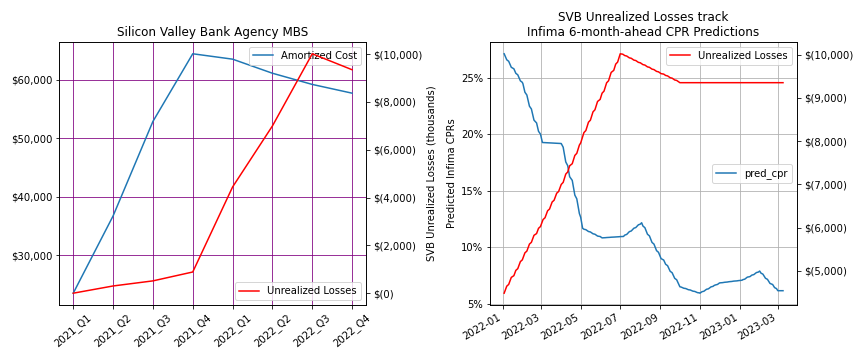
Figure 6: SVB’s MBS Portfolios Expanded in 2021, Followed by Losses in 2022 Tracking Infima's 6-Month Horizon Prepayment Predictions Closely
Prepayment Predictions as a Leading Indicator
How can an investor capture the attractive spreads and other advantages of agency MBS without risking damaging, even catastrophic losses? Through disciplined, reliable risk metrics and stress tests based on the most accurate prepayment predictions available and associated analytics. Infima provides the most accurate prepayment predictions of any vendor, together with comprehensive risk metrics, including concise measures of prepayment and extension risk. By using prepayment predictions as a leading indicator of future MBS prices, as discussed in MBS Price Predictors above, Infima clients can reduce positions before losses become unmanageable.
Infima also provides interest rate scenario analysis, allowing users to explore “what ifs”. Knowing the impact of potential future interest rate changes on future prepayment rates can alert investors to the severity of problems before they occur. Investors who incurred large MBS losses in 2022 may not have appreciated the potentially devastating consequences of inflation and the Fed’s proposed interest rate hikes. Scenario analysis can show the increasing risk of loss before the loss happens when there’s still time to change course.
Selling down, hedging a position, or shortening duration may result in lost opportunity or disappointment. Still, if based on sound considerations of prepayment risk management, it can avoid far graver disappointment in the future.
Infima can help you before any unknown risks cause your firm to hit the headlines.
--
Schedule a call with us to learn how Infima can help you ensure that you’re looking at the risks in your MBS portfolios with the right lens.