Nicholas Gunther
Co-Founder and Chief Solutions Officer
Part I: A Simple Screen
With quarterly returns of 5% or higher, even among the larger, more liquid pools, the final quarter of 2022 (Q422) offered agency mortgage-backed securities (MBS) investors a welcome respite from prior back-to-back quarterly losses.
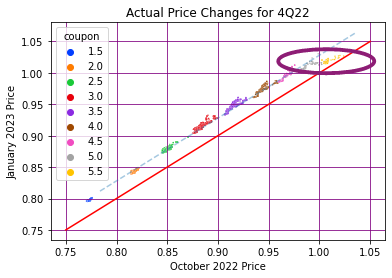
Figure 1: Price Changes by Coupon
As shown in Figure 1 above, large price movements (dotted-blue line) resulting from rallying rates and narrowing spreads over the quarter contributed significantly to these high returns. Still, the highest coupons (purple oval) missed most of or all of the rally. Realized prepayments also influenced the returns substantially. Of course, had rates sold off and spreads widened instead, unhedged holdings could have had significant losses.
How could investors have positioned themselves to capture the higher returns in advance while protecting themselves against downside risk? This article:
Establishes a framework to answer that question based on Infima tools, including the unparalleled accuracy of Infima’s predicted conditional prepayment rates (CPRs), and
Describes an elementary screen for agency MBS based on that framework that outperformed in multiple scenarios, including in the realized scenario returning 30 quarterly basis points (nearly 140 basis points per annum) above the return on the MBS pools the Screen rejected.
We’ll soon share subsequent articles detailing more complex screens (Part II) and apply the same techniques to position for future expected outperformance (Part III), but let’s first get to Part I’s Screen.
A Primer on Infima
Infima’s Predictions
In multiple interest rate scenarios, Infima provides predictions of agency MBS CPRs and associated cash flows, the latter including total returns based on indicative purchase and sale prices.1 The scenarios include a base scenario and shocks to that scenario of +/- 25 basis points. Infima also offers OAS, OAD and other MBS metrics (together, called “OAS+”) with interest rate paths powered by Numerix.
MBS Market Scenarios
To predict period returns for investment and portfolio formation, future sale prices at the period’s end must be forecast ex-ante (i.e., in advance) by investors.2 Since the future is uncertain, investors typically consider one or more possible future sales price scenarios that they consider reasonably likely and choose MBS that perform well in aggregate in all scenarios, weighting the performance in each scenario by its estimated probability when such weights are available.

Figure 2: Middle Coupons Lead, Highest Coupons Lag in Market Sales Price Scenario on Right (vs. Static “Formula Sales Price” Scenario on Left), Validating Infima Predictions
In this article, we use Infima CPR predictions and prices over Q4223 to screen Agency FNCL MBS pools with UPB > $50 million (large pools), considering only a formula sales price scenario assuming unchanged (static scenario) market conditions through the sales date, the MBS pool returns for which are shown at left in Figure 2. To evaluate the Screen’s results, we also consider the market scenario, shown at right, which assumes prices rise by the actual amount they, in fact, did over Q422. In both charts in Figure 2, the x-axis shows the predicted return while the y-axis shows the return based on the actual realized CPRs.
The two charts show clearly how Infima’s exceptional CPR prediction accuracy translated into similar return prediction accuracy. The blue vertical bars show 95% confidence intervals near the associated x-axis predictions.
Pool Selection Criteria
Investment selection requires one or more rules to determine when to make an investment. We consider below a simple screen based solely on the first scenario above, known fully ex-ante.
A Pool Metric Screen
Selection
One traditional approach is to select pools based on their metrics and other observations known with certainty on the investment date, including predictions based on such data. For this purpose, we take as features for observation (1) MBS pool coupon and vintage and (2) four metrics: OAS, OAD, OAC and predicted return based on the static sales price exit described above. Table 1 below shows excerpts of this data.
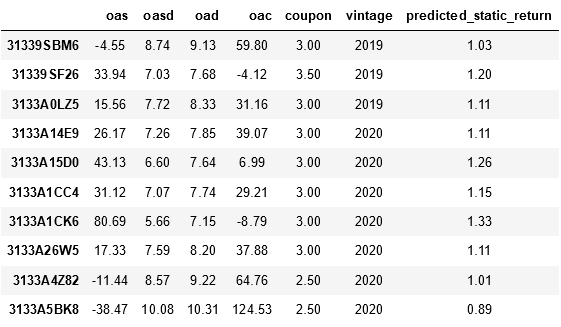
Table 1: Four Metrics with Coupon and Vintage for Large FNCL Pools as of October 2022
Screen
The following simple MBS screen using three of these metrics produced significant outperformance:
Rule 1: Invest only in pools with OAS & OAC > 0 and predicted static quarterly return > 1.1%
Rule 1 considers only the static scenario for selection. The market scenario is used only for validation, to “see how we did.” We’ll detail additional rules in future articles.
Digging Deeper
The balance of this section describes the motivation for the Screen and quantifies and analyzes its results.
The full data from Table 1 has nearly 10,000 rows, so we graph the data to develop the necessary insights. Because we want to use all four metrics to guide our pool selection, we use pair plots in Figure 3 to help us understand the interaction between the metrics while staying in two dimensions for easy visualization.
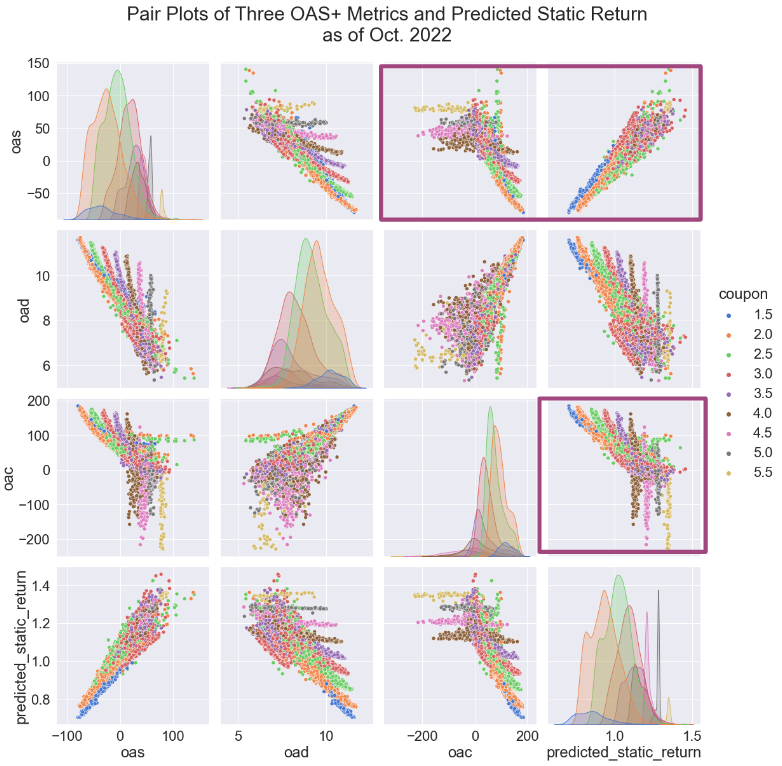
Figure 3: Ex-Ante Pair Plots by Coupon (Color) Showing Disassociation of OAC & OAS in Highest Coupons
Figure 3 is packed with information, the diagonal subplots showing the dispersion of each metric by coupon and the off-diagonal ones showing scatterplots for every pair of two metrics. The latter is symmetric about the diagonal with the axes reversed.
While most pair plots in Figure 3 look as expected (e.g., higher coupons generally have lower duration and higher OAS), the three marked in purple are particularly interesting. First, the relationship between OAS and OAC in the top row and the third column shows a breakdown of the usual inverse relationship in the highest coupons; instead, the relationship is essentially flat. There is little or no OAS benefit for bearing additional negative convexity. (In particular, the more negatively convex 5.5s are either trading rich, or the market doesn’t believe that the less negatively convex 5.5s are reliably better. A deeper investigation, while interesting, is beyond this article’s scope.)
One interpretation is that there’s a convexity bargain at the top of the coupon stack: low convexity has no OAS cost. A more skeptical interpretation disregards the possibility of such a “free lunch” and views the flat OAS/OAC graph as signaling inadequately priced risk in the higher coupons.
Supporting this skepticism are the two pair plots of OAS and OAC, respectively, vs. predicted static return. While the former generally displays a traditional increasing relationship between OAS and predicted return, the 2.5-3.5% coupons keep pace with the higher coupons, even exceeding them at the top. The relationship between predicted return and OAC is very similar to that between OAS and OAC. (With the benefit of hindsight in Figure 2’s right-hand chart, we can see the latter skepticism was justified; the higher coupons underperformed significantly.)
There are many ways of converting the second skeptical interpretation from qualitative to quantitative and actionable; a simple screen such as in Rule 1 is one of the simplest, based on three criteria: OAS, OAC and predicted static return. The final criterion comes from a ranking of the predicted returns; 1.1% is in the middle of the second quartile of the predicted pool (static) returns and, when combined with the other two criteria, still selects over 2,000 pools. The average OAD of these selected pools is over 1 ¼ years shorter than the other pools, reducing interest rate risk.
Outperformance Achieved
Actual Prepayments
Using actual, rather than predicted, prepayments for Q422 while keeping the static price assumption, the average return of these selected pools was 12 quarterly basis points (almost 50 basis points per annum) above the approximately 8,000 pools rejected.
Actual Prepayments and Market Prices
Using actual prepayments for Q422 and actual market exit prices from Infima’s price database, as shown at right in Figure 2, the average return of the selected pools outperformed by almost 30 quarterly basis points (over 130 basis points per annum), 2.5 times the outperformance predicted under the “no price change” static assumption above.
Graphical Representation
Figure 4 shows the market returns of the selected and rejected pools, with horizontal blue and brown lines indicating their mean realized returns. The selected pools are highlighted in the left-hand chart, and the rejected pools are highlighted in the right-hand chart.
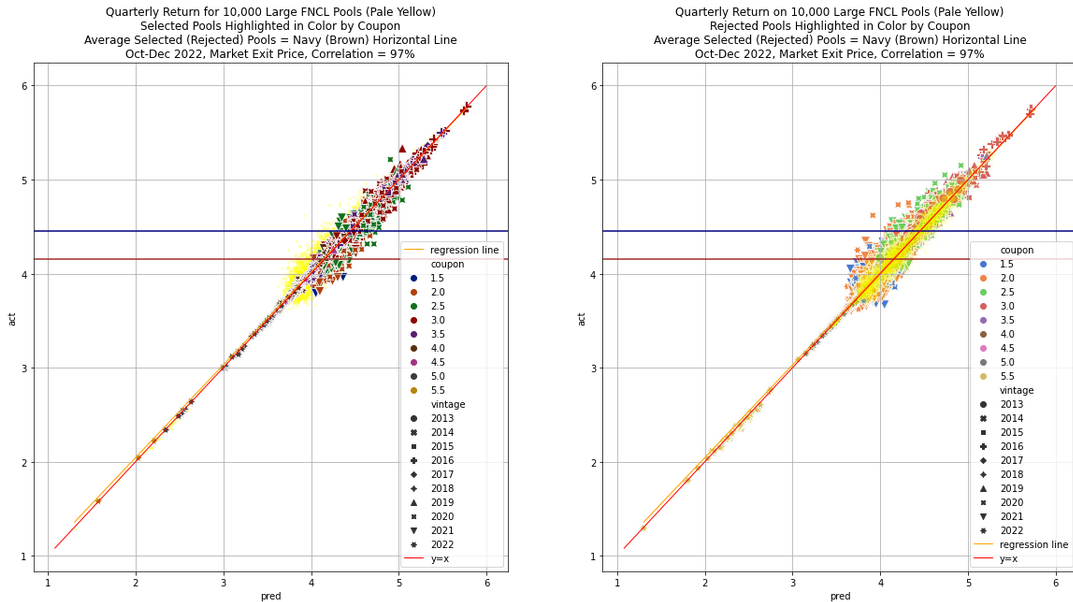
Figure 4: Pools Selected by Infima Out-Performed Rejected Pools by Nearly 30 Basis Points over the Quarter
Outperformance Analysis
As shown in Figure 5, Rule 1 selected pools with significantly shorter duration and somewhat earlier vintage, concentrating on the outperforming middle coupons 2.5-4.0%, as shown at right in Figure 2. In particular, the selected pools avoided the highest coupons, shown in darker colors in Figure 2, which considerably underperformed. Notably, the rule achieved its outperformance in a decreasing rate environment while controlling duration, and thus the risk of underperformance had rates sold off instead of rallying.
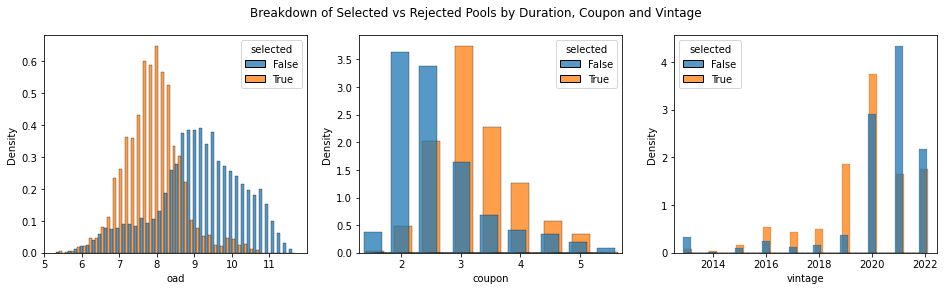
Figure 5: Comparison of Selected and Rejected Pools
Takeaways
Investors can realize outperformance by selecting pools predicted by Infima to outperform over an appropriate range of one or more scenarios. Selection rules providing such outperformance predictions include screens based on OAS metrics and return predictions. Part II in this three-part series uses Infima’s tools to produce more complex rules, and Part III will show how you can select pools in the market for prospective outperformance.
1 We define the MBS return as the quotient of net cash flow over purchase price. Net cash flow is the sum of the sales price at the sale horizon date, plus all interest and principal (including prepayments) received during the MBS holding period, minus the (known) purchase price. In this article, returns are (1) determined without discounting in light of the (short) single quarter period and (2) quoted quarterly except where otherwise explicitly stated.
2 Infima predicts prepayments, including OAS and related metrics, but neither future interest rates nor prices. A future article will discuss how investors may use Infima’s predictions to infer possible future prices.
3 For technical reasons, we used the period from October 10, 2022 to January 10, 2023 to capture some of the January rally and increase returns.